
INTRODUCTION
The League of Michigan Bicyclists (LMB) advocated successfully in 2017 to clarify the definition of e-bikes in Michigan law. Recent developments in battery technology have dramatically increased the range, power, and usefulness of this vehicle category, and led to a surge in interest and popularity. E-bikes have the potential to open up bicycling for transportation and pleasure to a much broader audience and enable uses – like carrying 100-pound bags of gravel or multiple children – that were formerly exclusive to cars and trucks.
As part of its mission to improve life through bicycling, LMB is now advocating for a statewide program to incentivize e-bike purchases, especially for those who stand to gain the greatest benefits from low-cost transportation, healthy activity, and cleaner air.
- E-bike purchase incentive programs are increasingly popular, including in growing states like Minnesota and Colorado.
- People who switch some or all of their vehicle miles to an e-bike save money from avoided gas, maintenance, and health care costs, and significantly reduce their carbon emissions – and they’re happier with their commutes.
- E-bike incentives attract positive earned media and support a virtuous cycle of more people biking, better places to bike, and more reasons to move to Michigan.
- A $5 million annual investment in an e-bike incentive program will benefit Michiganders and support Michigan’s talent attraction efforts by enabling and encouraging dense, walkable development.
WHY E-BIKES
E-bikes are affordable and efficient for many transportation needs. They combine the health and air quality benefits of a bicycle with the comfort and convenience of a motor assist for carrying cargo and passengers, while producing less congestion and putting less wear and tear on roads than cars. E-bikes are more expensive than pedal bikes, but much less than EVs.
E-bikes can replace car trips more effectively than pedal bikes, especially for older riders and people with disabilities. In one study, “people who purchased an e-bike increased their bicycle use from 2.1 to 9.2 km per day on average, representing a change in bike as share of all transport from 17 to 49 percent.” (Fyhri & Sundfør, 2020) In another, “average usage was in the order of 15–20 miles per week, and was accompanied by an overall reduction in car mileage of 20%.” (Cairns et al, 2017)
With an electric assist, peak effort (such as on hills) is reduced while speed and comfort are increased, but the health benefits of moderate-intensity activity are retained. A 2017 survey of 1,755 e-bike riders determined the top three barriers to bicycling were hills, lengthy distances to desired destinations, and not wanting to arrive at destinations sweaty. E-bikes diminished all these barriers. (MacArthur et al, 2017)
Finally, e-bikes can be an important component of a long-term transportation plan. While e-bikes are more useful for replacing short trips than long trips, they use significantly less energy per mile than gasoline or electric-powered cars and trucks, and they present fewer supply chain challenges than EVs given their smaller batteries. And they’re simply fun: all the joy of a bicycle with the added benefit of a powerful assist.
This is what pure bliss feels like. A day in the life with a car free mom ❤️ pic.twitter.com/7cwCDagQcN
— sociallychrissy (@sociallychrissy) May 9, 2024
INCENTIVES
High-incentive programs tend to induce new purchases, especially when set aside for low-income groups. They support people otherwise priced out of the market.
Denver started offering an e-bike purchase incentive in 2022. Since then, more than 4,700 residents have used the incentive, and the city has found:
- On a per-mile basis, e-bikes cost 40% less to operate than EVs and nearly 75% less than ICEVs.
- Cumulative annual savings of over $1 million (conservatively) from the program.
- E-bikes emit 3% of the CO2e emissions as EVs and 1% of the CO2e as ICE vehicles.
- 71% of survey respondents reported using their gas vehicles less often.
- 67% of the program funding went to income qualified residents.
- 65% of Ride App users were riding at least once daily, and 90% were riding weekly.
- The average trip length of Ride App users was 3.3 miles, with 84% of trips less than 5 miles, and 65% of trips less than 3 miles.
(Source: ridereport.com/blog/ebike-inventive-programs)
Based on recent research on incentive effectiveness, LMB recommends the following for an initial incentive program:
- Provide an incentive of $300 for all e-bike purchasers, with an additional $300 for low-income households, as a point-of-sale discount available at Michigan retailers or through direct-to-consumer companies with a minimum 1-year warranty and battery safety certification requirements. At least 50% of annual incentive dollars should be reserved for low-income households. The incentive could be limited to a maximum of 90% of the total purchase price.
- Designate a state agency such as the Office of Future Mobility and Electrification and/or Michigan Department of Treasury to administer the program and invite eligible bicycle retailers (both brick-and-mortar and online) to register. Once registered, the retailers would provide point-of-sale discounts in the incentive amount and submit the data for reimbursement.
- Partner with academic institutions for tracking, survey, and data collection. Conduct a survey at sale to collect make and model purchased, demographics of purchaser, intended use, and email address for follow-up. Conduct a follow-up survey with participation incentives (such as a $50 service/accessory voucher) 6 months to 1 year after purchase to collect data on odometer / miles traveled, use patterns, and vehicle trips replaced. Consider trip tracking with a sample of participants to validate data.
- Partner with local organizations to identify and connect with participants, and with local bike shops for outreach, access to service, and ability to demo bikes.
SAFETY
A transportation system based on bicycles is far safer than a system based on cars and trucks. E-bike riders are more vulnerable in a crash than drivers, but less hazardous to other road users, especially pedestrians.
Broad e-bike adoption may build support for safer infrastructure. (Zipper, 2022) A 2019 study showed that bike facilities increase safety for every road user, drivers included: “Better safety outcomes are associated with a greater prevalence of bike facilities – particularly protected and separated bike facilities – at the block group level and, more strongly, across the overall city.” (Marshall and Ferenchak, 2019)
HEALTH
Bicycling can improve cardiovascular health, help with diabetes management, improve mental health and mood, improve bone health, increase muscle strength, and improve joint mobility. E-bike use generates similar benefits to conventional bikes. (Alessio et al, 2021; Hoj et al, 2018) Bikes also emit far less harmful particulate matter (PM2.5) from both exhaust and non-exhaust sources like tire and brake wear, compared to motor vehicles. (OECD, 2020) These benefits can be quantified.
On an individual level, the U.S. DOT instructs grant applicants to estimate a $6.31 value per induced cycling trip in mortality risk reduction (U.S. Department of Transportation, 2022); an incentive that leads to an extra 100 cycling trips generates $631 in health value alone. On a societal level, a 2012 study found that if bicycling replaced 50% of short car trips in the study area (11 metro areas, about 30 million people in the Midwest U.S.) “the combined benefits of improved air quality and physical fitness would exceed $8 billion/year.” (Grabow et al, 2012)
IMPACT
A shift to e-bikes can reduce:
Parking, a significant invisible tax on Michigan small businesses. Bikes require much less space for parking than motor vehicles.
Greenhouse gas emissions. According to the E-Vehicle Incentive Impact Tool (McQueen, 2020) a $2 million investment in an e-bike credit of $500 would reduce CO2 emissions by 3.9 million kilograms, compared to 3 million kg for a $2 million investment in an EV credit of $2,500.
Electricity demand. E-bikes can travel about 400-500 miles on $1 of electricity. A typical e-bike range is around 40 miles. E-bike batteries can be charged from a regular home outlet, and typically last about 1,000 charging cycles before a drop in capacity. Compare the amount of electricity used by an e-bike to EV cars and trucks:
- E-bike: up to 750 Watts
- Chevy Bolt: up to 150,000 Watts
- Ford F-150 Lightning: up to 340,000 Watts
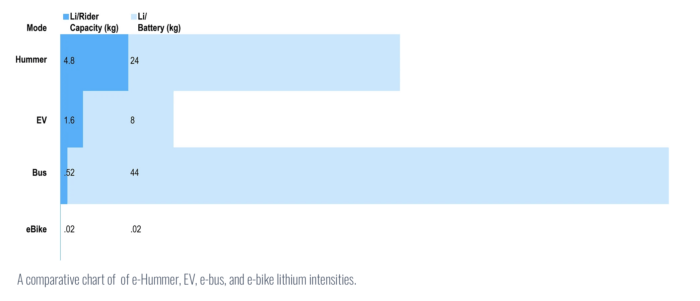
Lithium demand. Because they require less power, e-bike batteries are much smaller and use much less lithium than EV batteries. Substituting e-bikes for EVs reduces the financial pressure to take shortcuts and engage in environmentally destructive lithium mining (Riofrancos et al, 2023).
REFERENCES
Alessio H, Reiman T, Kemper B, von Carlowitz W, Bailer AJ, Timmerman K (2021). Metabolic and Cardiovascular Responses to a Simulated Commute on an E-Bike. Translational Journal of the ACSM: Spring 2021 – Volume 6 – Issue 2 – e000155 https://journals.lww.com/acsm-tj/Fulltext/2021/04150/Metabolic_and_Cardiovascular_Responses_ to_a.5.aspx
Cairns S, Behrendt F, Raffo D, Beaumont C, Kiefer C (2017). Electrically-assisted bikes: Potential impacts on travel behaviour. Transportation Research Part A: Policy and Practice, Volume 103, 2017, Pages 327-342, ISSN 0965-8564. https://doi.org/10.1016/j.tra.2017.03.007.
Fyhri A, Sundfør HB (2020). Do people who buy e-bikes cycle more?, Transportation Research Part D: Transport and Environment, Volume 86, 2020, 102422, ISSN 1361-9209. https://doi.org/10.1016/j.trd.2020.102422.
Grabow M, Spak S, Holloway T, Stone B, Mednick A, Patz J (2012). Air Quality and Exercise-Related Health Benefits from Reduced Car Travel in the Midwestern United States. Environmental Health Perspectives 120:1 https://doi.org/10.1289/ehp.1103440
Hoj T, Bramwell J, Lister C, Grant E, Crookston B, Hall C, West J (2018). Increasing Active Transportation Through E-Bike Use: Pilot Study Comparing the Health Benefits, Attitudes, and Beliefs Surrounding E-Bikes and Conventional Bikes. JMIR Public Health and Surveillance 2018;4(4):e10461 https://publichealth.jmir.org/2018/4/e10461
MacArthur J, Cherry C, Harpool M, Scheppke D (2017). A North American Survey of Electric Bicycle Owners. NITC-RR-1041. Portland, OR: Transportation Research and Education Center (TREC). https://pdxscholar.library.pdx.edu/trec_reports/161/
Marshall W, Ferenchak N (2019). Why cities with high bicycling rates are safer for all road users. Journal of Transport & Health, 13, 100539. https://doi.org/10.1016/j.jth.2019.03.004
McQueen M (2020). The Electric Vehicle Incentive Cost and Impact Tool. Hosted by Transportation Research and Education Center (TREC), Portland State University. https://trec-pdx.shinyapps.io/incentive-impact-tool/
OECD (2020), Non-exhaust Particulate Emissions from Road Transport: An Ignored Environmental Policy Challenge, OECD Publishing, Paris, https://doi.org/10.1787/4a4dc6ca-en.
Riofrancos T, Kendall A, Dayemo K, Haugen M, McDonald K, Hassan B, Slattery M (2023). Achieving Zero Emissions with More Mobility and Less Mining, Climate and Community Project. https://www.climateandcommunity.org/more-mobility-less-mining
U.S. Department of Transportation, Office of the Secretary (2022) Benefit-Cost Analysis Guidance for Discretionary Grant Programs. March 2022 (Revised). https://www.transportation.gov/office-policy/transportation-policy/benefit-cost-analysis-guidance-discretionary-grant-programs-0
Zipper D (2022). Electric Bicycle Incentives Go Local. PeopleForBikes. https://www.peopleforbikes.org/news/electric-bicycle-incentives-go-local